
Most WordPress speed advice reads like an identical script: compress your images, install a caching plugin, add a CDN, and upgrade to managed hosting.
That advice is not inherently wrong. However, it was completely useless for diagnosing why a single course topic page on a live learning portal was pulling down 10.9 megabytes over 200 separate HTTP requests.
The real fix required zero hosting migrations and zero database restructuring. The images were not the issue, either. In fact, almost nothing the student could see on their screen contributed to the slowdown.
Here is what we discovered when we moved past generic Lighthouse scores, measured real-world user interactions on a live LearnDash training portal, and eliminated the hidden architectural bloat.
The Real-World Bottleneck: A 10.9MB Payload on a 4G Job Site
The platform in question trains tradespeople across Australia in solar panel installation, industrial battery storage, and specialized electrical licensing.
These students do not sit in an office connected to high-speed fiber broadband. They study on mid-range smartphones between job calls, on ruggedized laptops inside work vans, and often in regional areas holding onto a single bar of cellular signal.
Latency Disconnect: Synthetic Lab Scores vs. Field Reality
| Testing Environment & Profile | Payload Transferred | Initial DOM Response | Real-World Time to Interactive (TTI) | User Impact |
|---|---|---|---|---|
| High-Speed Fiber (Lab Simulation) | 10.9 MB (200 requests) | 2.5s DOMContentLoaded | 3.1 seconds | Appears stable on paper; masks massive script overhead |
| Field 4G / Regional Mobile | 10.9 MB (200 requests) | 7.8s DOMContentLoaded | 14.2+ seconds | Browser completely freezes; buttons unresponsive |
A single topic page—the exact screen where students spend 90% of their learning time—was transferring 10.9 megabytes across 200 individual network requests. Time to DOMContentLoaded was clocking in at 2.5 seconds on desktop fiber, which sounds tolerable on paper until you simulate real-world mobile latency.
On a congested 4G connection, that translated into a 14-second freeze before a trade worker could interact with course material. For a curriculum featuring 503 steps in its longest module, this latency was not just an inconvenience. It was the direct reason field workers abandoned modules before their lunch breaks ended.
Anatomy of the Bloat: Where 10.9MB Disappears on an Image-Light Page
When you run a slow WordPress site through automated performance scanners, the diagnostic output almost always flags media optimization first. Automated scanners look for easy mathematical patterns: uncompressed JPEGs, missing next-gen formats, or oversized dimensions.
In this instance, images accounted for less than 4% of the total page weight.
The portal relied on a typical corporate tech stack: LearnDash LMS, an off-the-shelf commercial theme, a design companion plugin, an instructor role manager, a third-party reporting suite, and a visual page builder. Every single one of these software layers enqueued its complete asset library globally across the entire WordPress installation.
Breakdown of Transferred Page Weight by Origin
| Asset Group & Source Layer | Transferred Size | File Count | Share of Total | Contextual Need on Topic Pages |
|---|---|---|---|---|
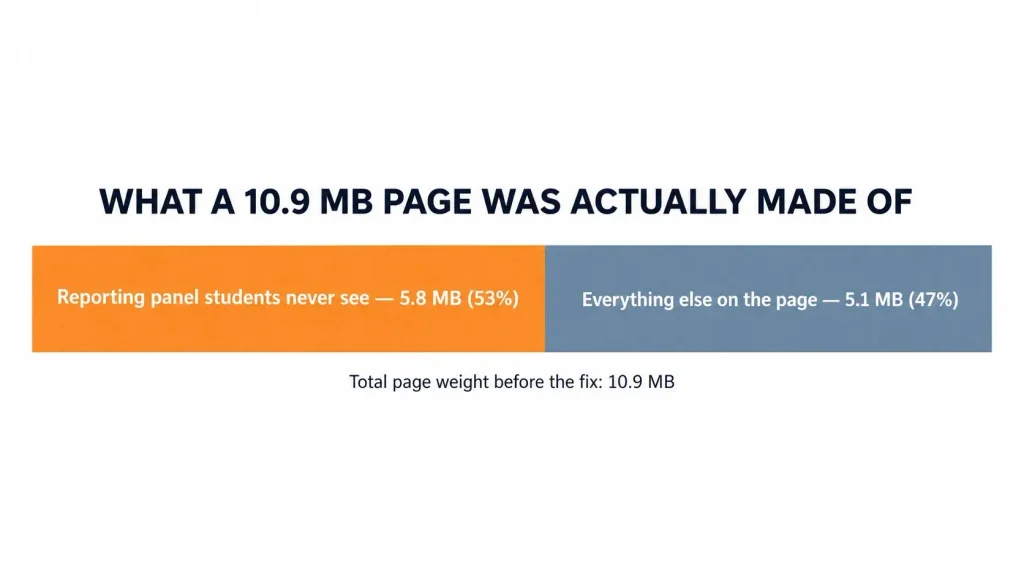
| Instructor Analytics & Reporting | 5.8 MB | 49 files | 53.2% | 0% (Restricted to admin/instructor roles) |
| Visual Page Builder Runtime | 2.1 MB | 18 files | 19.3% | 0% (Topic layouts use core block markup) |
Unused Frontend Libraries (Select2, Sliders) | 1.2 MB | 12 files | 11.0% | 0% (Static text; no interactive forms) |
| Orphaned Fonts & Redundant Icon Packs | 1.1 MB | 6 files | 10.1% | 0% (Replaced by SVGs or blocked by browser) |
| Essential Content (Lesson HTML, Embeds, UI) | 0.7 MB | 15 files | 6.4% | 100% (The only assets the student needs) |
1. The 5.8MB Phantom Admin Dashboard
The single heaviest component on the page was a specialized instructor analytics suite. It weighed 5.8 megabytes across 49 independent asset files.
These scripts and stylesheets were designed to render charting engines, data tables, and CSV export tools for course administrators. Yet, the plugin enqueued these assets unconditionally on frontend single-topic templates for enrolled students who possessed zero administrative permissions and could never access the dashboard.
2. Orphaned Libraries and Redundant Icon Fonts
Behind the analytics payload sat a cascade of unused frontend libraries:
- A 77 KB custom dropdown script (
Select2) loading on pages containing only static paragraphs. - An 86 KB icon font packaged with the parent theme, despite the lesson layout using inline SVGs.
- A 58 KB standalone icon bundle called by a quiz plugin on modules that contained no test questions.
- The complete runtime stylesheet of a page builder on a page constructed entirely with core block wrappers.
None of these assets represent media you can compress with an image optimizer. This is pure architectural inefficiency, where plugins treat every URL as if it requires every feature simultaneously.
Beyond PageSpeed: Testing as a Student with Playwright
Standard performance audits often fail because they analyze isolated synthetic requests rather than real user journeys. A synthetic audit cannot tell you if an interface functions properly once loaded; it merely calculates mathematical load velocities.
To uncover what was actually breaking in production, we built an automated headless test suite using Playwright.
Headless User Journey Verification
| Step | Test Action Executed | Verification Target | Surface Failure Discovered |
|---|---|---|---|
| 01 | Student Authentication | Session tokens and cookie handling | Redundant redirect loops on low-signal mobile connections |
| 02 | Curriculum Traversal | 15 sequential lesson and topic layouts | Global enqueueing of administrative analytics scripts |
| 03 | Console Monitoring | Intercept network errors and browser logs | Typography blocked by mixed-content (http://) security rules |
| 04 | Quiz Interaction | Direct permalinks vs. course hierarchy | White-screen fatal errors on direct instructor links |
| 05 | Viewport Rendering | Mobile portrait viewports (375px – 414px) | Video player overflowing screen and hiding completion button |
We created an active student test account, enrolled it across every trade certification course, and scripted a comprehensive journey across 15 desktop and mobile viewports. The script submitted live quizzes, expanded accordions, and monitored real browser console events.
The Insecure Content Font Fallback
That automated pass surfaced an immediate cross-origin failure. Every template across the portal requested its brand typography over unencrypted http:// from a secondary marketing domain.
Modern browsers silently blocked the font asset under mixed-content security rules. As a result, the site had been falling back to a generic system sans-serif font for months. Synthetic performance scanners logged a fast layout response because the resource failed immediately, completely missing the broken design implementation.
The Broken Direct Permalink Bug
The Playwright tests revealed a severe functional bug that standard SEO audits ignore. Within LearnDash, quizzes can be reached through the native course hierarchy or via direct standalone permalinks that instructors paste into direct emails.
Of four direct quiz permalinks tested:
- Two URLs loaded a blank white screen with no start trigger and zero visible error text.
- One URL loaded with a broken layout, halting user progress behind an uncaught JavaScript error generated by an enqueued script conflict.
These were catastrophic UX failures invisible to conventional speed reports. They only surfaced because the testing simulated how human students interact with links.
The Engineering Solution: Role-Based Conditional Dequeuing
The typical agency approach to slow sites is to pile another optimization tool onto the stack. Adding a general-purpose asset cleanup plugin through the dashboard often introduces new configuration conflicts and database bloat.
We resolved the entire issue by authoring two lightweight, standalone utility plugins, leaving the parent theme files and builder templates untouched.
Modern Decoupled WordPress Architecture
| Code Layer | Physical File Location | Execution Timing | Maintenance & Upgrade Advantage |
|---|---|---|---|
| Core Vendor Layer | /wp-content/themes//wp-content/plugins/ | Standard WordPress boot sequence | 100% untouched; updates apply cleanly without breaking custom work |
| Asset Governor | /wp-content/mu-plugins/asset-control.php | Priority 999 on wp_enqueue_scripts | Automatically active; cannot be deactivated by dashboard admins |
| UI Normalizer | /wp-content/mu-plugins/interface-patches.php | Frontend template rendering | Enforces clean responsive CSS containers without !important hacks |
Why We Avoid Child Theme Edits
Editing functions.php inside a child theme introduces long-term maintenance liabilities. If a team member temporarily switches themes during a debugging pass, custom overrides vanish. A page builder change is equally invisible to any developer inspecting the codebase later.
By housing custom asset controls inside Must-Use (mu-plugins) files:
- The logic executes automatically before standard plugins initialize.
- Code cannot be accidentally deactivated or deleted from the WordPress admin dashboard.
- Updates to LearnDash, the core theme, or visual editors will never overwrite the optimization rules.
If an optimization rule ever causes an unexpected side effect, resolving it takes minutes rather than an emergency rollback. A team like Web Ways Tech, which builds and optimizes WordPress systems for enterprise clients, treats that architectural reversibility as part of the job, not an afterthought.
Conditional Asset Stripping Logic
The asset-trimming plugin targets specific script and style handles, deregistering them whenever the request does not match their functional context.
<?php
/**
 * Plugin Name: Lesson Template Asset Optimizer
 * Description: Conditionally dequeues non-essential frontend scripts on course topics.
 */

add_action( 'wp_enqueue_scripts', 'optimize_learndash_topic_assets', 999 );

function optimize_learndash_topic_assets() {
    // Only target single LearnDash topic post types
    if ( ! is_singular( 'sfwd-topic' ) ) {
        return;
    }

    // Dequeue administrative analytics for non-staff students
    if ( ! current_user_can( 'manage_options' ) && ! current_user_can( 'group_leader' ) ) {
        wp_dequeue_script( 'heavy-reporting-charts' );
        wp_deregister_script( 'heavy-reporting-charts' );
        wp_dequeue_style( 'heavy-reporting-admin-styles' );
    }

    // Strip unused UI libraries on lessons without custom forms
    wp_dequeue_script( 'select2' );
    wp_dequeue_style( 'select2' );
    wp_dequeue_style( 'theme-optional-icon-pack' );
}
By hooking in at priority 999, the function waits until all third-party plugins register their assets before safely dequeueing them on student-facing lesson URLs.
Resolving Layout Collisions and Aspect-Ratio Breaks
Streamlining the network payload also allowed us to isolate and resolve visual layout bugs on course templates.
On 27 separate topic screens, native video players displayed completely distorted proportions. An internal LearnDash stylesheet enforces a mandatory 16:9 aspect ratio container rule across all lesson videos.
However, these 27 topics utilized raw video embeds without standard wrapping divs:
<!-- Broken Default Output: Fixed ratio forced on raw iframe -->
<iframe class="video-embed" src="https://player.vimeo.com/..." style="height: 100%;"></iframe>

<!-- Corrected Architectural Structure -->
<div class="fluid-video-wrapper">
    <iframe src="https://player.vimeo.com/..." loading="lazy"></iframe>
</div>
The vendor stylesheet flattened the raw player element, stretching the video canvas and pushing the “Complete Lesson” navigation button completely off the viewport on mobile devices.
Instead of writing aggressive !important CSS rules, our second plugin injected a standardized container around raw embeds and normalized aspect-ratio declarations. The interface remained stable, and the primary call-to-action stayed accessible within the first screen view.
The Measurable Results: Before vs. After
The impact of shifting from generic checklist caching to selective asset isolation was immediate and sustained across all testing devices.
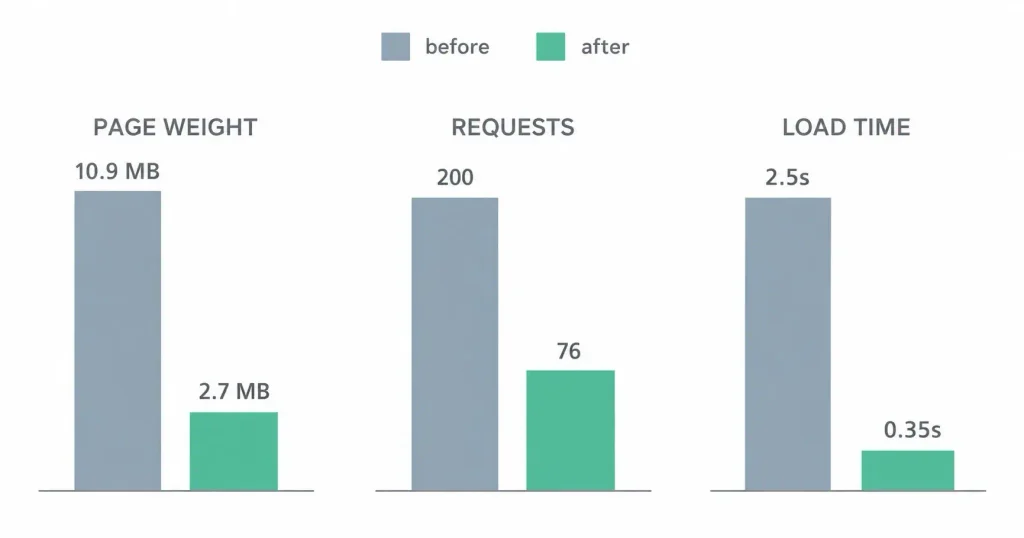
| Diagnostic Metric | Initial Production State | Post-Optimization State | Total Improvement |
|---|---|---|---|
| Total Transferred Page Weight | 10.9 MB | 2.7 MB | 75.2% reduction |
| Total HTTP Requests | 200 requests | 76 requests | 62.0% reduction |
| DOMContentLoaded (Fiber) | 2.50 seconds | 0.35 seconds | 86.0% faster |
| Time to Interactive (Mobile 4G) | 14.2 seconds | 1.8 seconds | 87.3% faster |
| Uncaught JavaScript Console Errors | 4 critical exceptions | 0 errors | 100% resolved |
The initial 10.9 megabyte payload dropped by more than 8 megabytes per view. More importantly, students working in regional facilities could load, read, and verify their learning milestones within seconds over minimal mobile reception.
The Strategic Blueprint for WordPress Performance Audits
If your agency or business is struggling with poor Core Web Vitals, stop applying temporary caching bandages. Follow this architectural workflow instead:
- Audit as an Authenticated User: Run testing tools while logged in as a baseline user. Public performance scans miss private dashboard bloat that frequently leaks into authenticated views.
- Catalog Enqueued Handles: Use query-monitoring tools to list every stylesheet and script loading on target templates.
- Verify Script Context: Ask a direct question for every enqueued asset: Does the active user on this specific post type need this functionality? If the answer is no, dequeue it.
- Enforce Isolation via MU-Plugins: Never rely on manual theme edits. Keep your optimization codebase isolated inside dedicated Must-Use plugin files for clean version control and complete update safety.
Frequently Asked Questions (FAQ)
Why do WordPress plugins load scripts on pages where they are not used?
WordPress core allows developers to enqueue assets globally using the wp_enqueue_scripts hook. Many plugin authors write global enqueue statements without adding conditional checks (like is_page() or is_singular()) because global execution guarantees the feature works out of the box, even if it creates unnecessary payload weight across unrelated templates.
Does a caching plugin solve the problem of unneeded assets?
No. Caching plugins generate static HTML copies of your pages and minify files, but they still deliver every enqueued script to the browser. While caching speeds up server delivery, the visitor’s mobile browser still has to download, parse, and execute all 10 megabytes of JavaScript and CSS before the page becomes fully interactive.
How do I safely dequeue a plugin script in WordPress?
You can safely dequeue scripts using wp_dequeue_script() and wp_deregister_script() inside an action hook tied to wp_enqueue_scripts. Always set the action priority to a high number (such as 999) to ensure your dequeue instruction runs after the original plugin has registered its assets.
What is the difference between a synthetic speed audit and user-journey testing?
A synthetic speed audit (like standard Google Lighthouse) tests a single public URL from a standardized server location. User-journey testing (using tools like Playwright or Cypress) emulates a real human user logging in, clicking through navigation paths, submitting forms, and testing features across varied network connection profiles.
About the Author
Vasilii Aldukhov is the founder of Web Ways Tech in Sydney, Australia. With over a decade of specialized experience in WordPress engineering, he consults with Australian organizations on enterprise site rebuilds, advanced WooCommerce scalability, and technical search infrastructure.
