

Discover the benefits of data visualization and how to apply it to SEO.
Any digital marketing campaign needs to plan and carry out a great SEO strategy. But in order to present the story in a way that appeals to our clients, numbers are needed. However, sifting through large data can be mentally taxing and laborious. Data visualization can help with this.
Data visualization is the process of presenting numerical data in a visual environment, such as a chart, graph, or map. Additionally, it aids in the development of data stories that clearly convey findings. Continue reading to learn more about data visualization, its value, and how to use it for your SEO campaign.
Various Forms of Data Visualization
For many years, adding data to an Excel spreadsheet and turning it into a chart, graph, or table was the simplest way to create data visualization. The technique has been modified a bit over the past few decades, but it is still effective. Users can now generate complex data visualizations thanks to the following options:
- Bulleted lists.
- Cartoon charts.
- round trees.
- Animated charts.
- blobby clouds
- info art.
- Heatmaps.
- Dashboards.
- Infographics.
and numerous others.
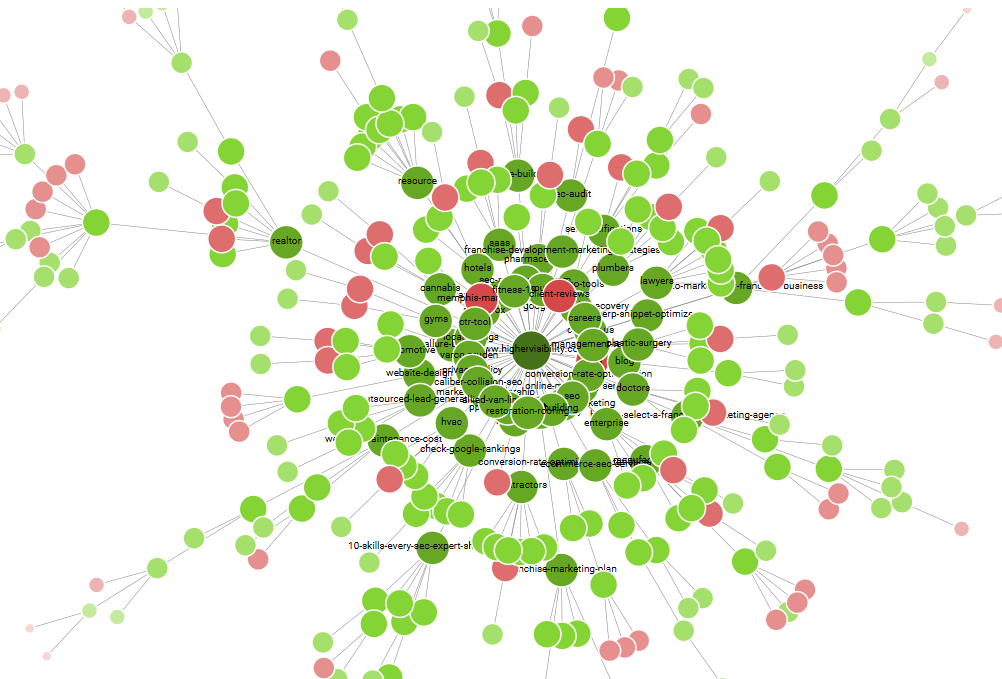
The image above is an example of data visualization used to view the crawl hierarchy of a website.
How To Pick The Correct Type Of Visualization
Pick the appropriate visualization type to clearly convey your message.
Prior to beginning:
- Decide on the main idea you want to convey, then succinctly state it.
- Find the information you need to convey your point, then think about simplifying it to make it more understandable.
- Take into account the different types of data you have, including comparisons, trends, patterns, distribution, and geographic information.
- Think about the display type that is straightforward and will grab the audience’s attention.
- Your visualization should be available to all visitors, just like any other site material.
- Think about the details to include in the picture so that readers may comprehend and interpret the information.
The significance of data visualization
Through machine learning, contemporary businesses are producing enormous amounts of data. Although fantastic, we must sift, filter, and explain the data in order for stakeholders and business owners to understand it.
Data visualization makes it simple to spot patterns and trends in your SEO approach fast. Conveying insights is made simple and quick through visualization. Developing a data visualization routine in your company has many advantages.
Develop strong value propositions
It is simple to explain to clients or stakeholders why and how your products are good, but it is more difficult for those same individuals to comprehend what you are saying. Visualizing your data is a great way to get more people on board with your ideas. The tactic can boost a company’s success by converting website traffic into sales.
Facilitate Quicker, Simpler Communication
Every company wants to promote its goods to the general population. However, few people spend the time reading lengthy texts. Instead, make the material more digestible by turning it into presentable visual content.
The focus will be more on visual information than on text. Potential clients, consumers, and investors are drawn in and won over by the pictures. Thus, this encourages traffic to your business, which results in success.
Examine trends and patterns
Specific patterns and trends are essential to business industries. Your responsibility is to choose based on market trends and patterns. The entire process of finding present and future opportunities is summarized via data visualization. Additionally, the data assists business owners in developing into careful decision-makers who are aware of the state of the industry.
Encourage your teammates
The effort team members put forth in the process determines the success of the business. Every employee in your company enjoys seeing the company achieve progress. Data visualization can be used to determine the starting point and future course of a firm. The procedure can energize your employees, spur them on to greater productivity, and grow your company.
Enhance the client experience
Improving your customers’ experience through data visualization is essential. The data makes it simple to guarantee that clients are satisfied and that their needs are met. On-demand data shaping, filtering, and desegregation are simple with data visualization.
SEO and Data Visualization
The volume of keyword searches that go into determining a site’s position is greatly influenced by SEO data. The number of times people search for a certain term during a specified time period is known as the keyword search volume. The phrase also describes how many individuals are interested in a particular keyword.
For organic traffic in various internet marketing aspects, SEO data is equally crucial. The latter is the quantity of visitors to your website. Another crucial SEO strategy that affects the dependability of your website is page speed. The time it takes for a page to load is not something your website visitors have. Additionally, page speed has an impact on how you appear in search results.
Making Use Of Data Visualization To Boost SEO
The interpretation of your data is greatly influenced by how it is visualized. The search volume for various keyword sets you wish to use in your next campaign can be represented visually. Tools for visualization can also provide a thorough examination of your website from the standpoint of SEO. The audience can better understand every element of an SEO campaign when you provide your content in charts and graphs.
Increase SEO capacity
Your SEO techniques can be improved in a number of ways with data visualization. Here are the areas where visualization will have the greatest impact on SEO.
Competitive Research
Developing your SEO strategy also entails monitoring what rivals are doing. You can learn from the analysis what needs to be done and where improvements can be made.
Visualization can assist you with:
- Analyze the social media presence of rivals.
- Find the most competitive keywords.
- Examine the backlink profiles of competitors.
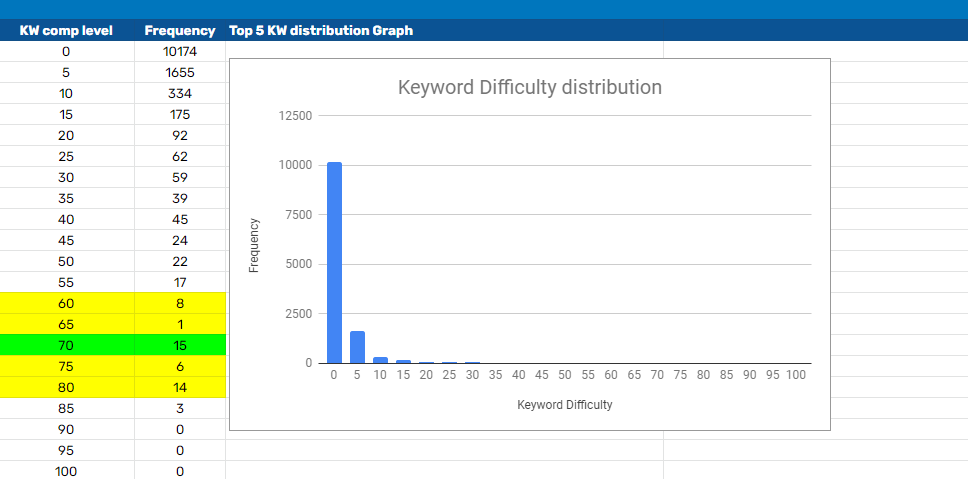
The example above shows how to use a bar chart to see how keywords are ranked according to their difficulty.
Analysis of backlinks
You can create an effective link-building campaign with the help of visualization.
Some things to consider are:
- Place links to specific places.
- Backlinks’ caliber.
- The distribution of anchor text for backlinks.
Finishing up
For every company activity to be successful, data visualization is essential. The ability of visualization to visually represent complex data sets is what makes it so important. A successful recipe is anything that can reduce enormous volumes of data into infographics, charts, and graphs.
It goes without saying that incorporating visualization into your digital marketing activities improves SEO skills. Furthermore, judgments about business development and SEO are greatly influenced by how you present your data.
